The Stock Control "Reports" tab provides an extensively list of flexible Accounting Reports focusing on Inventory Management and Analysis
Better visualise and connect with your business data:
Audit Trails button
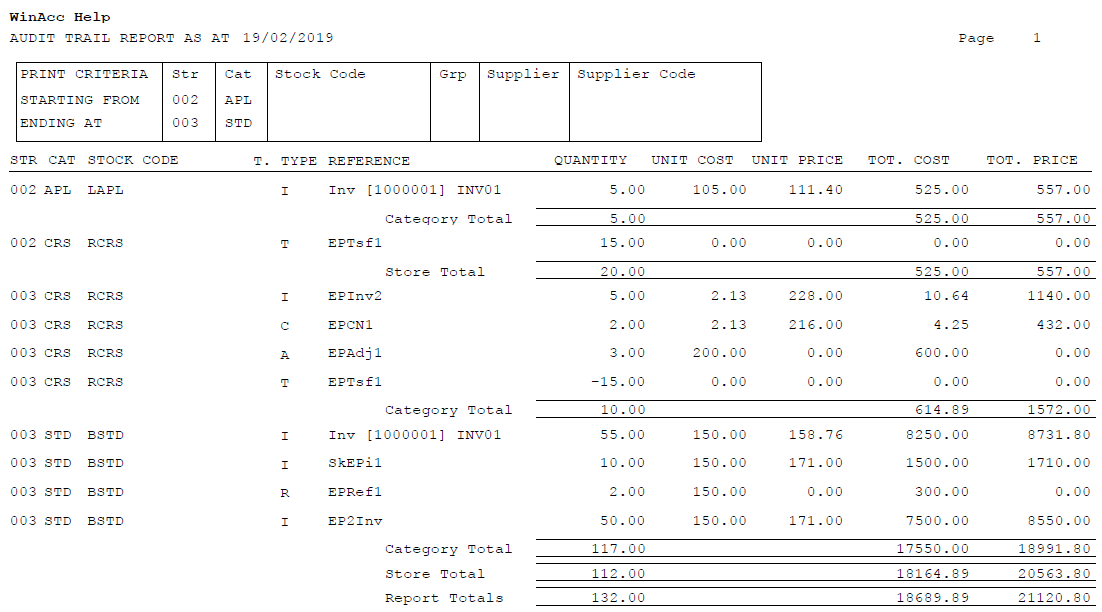
The Stock Audit Report provides you with vital data regarding a company's total stock of physical goods - matches against the corresponding accounting records
As inventory is a leading expense for small to medium sized businesses, making use of accurate and regular stock audits can aid you in better budgeting for inventory costs
Stock Audit Reports are especially important for manufacturing companies that convert raw materials into finished goods - Win Accounting's Stock Control makes it easy for you to create custom Stock Recipes, creating unique bill of quantities that make it easy to track and manage every stage of the production process
Use the Stock Audit Report to identify which items are under- or over-stocked - Use this valuable information to optimise your inventory, ensure the right mix and amount of stock on hand at all times
Easily receive a full picture of the financial health of your company and identify all instances of inventory loss as a result of damages, returns, dormant stock, etc.
Use this analysis to enhance the effectiveness and efficiencies of your storage procedures and stock control
Win Accounting's Stock Audit Report offers various ways to filter your report and hone in on specific accounts, stock items and/or stores
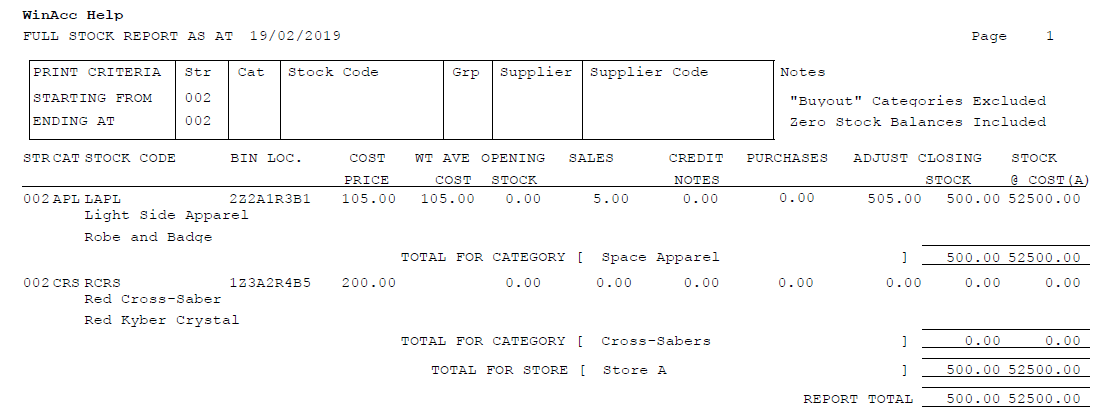
Use the Stock Report to quickly and easily track and manage your inventory - Use the valuable data and analysis to increase efficiency and productivity
Choose from a Full Stock Report, or receive a Summary Report by Store or Category
Easily export your Stock Report as a CSV-file, allowing the data to easily be imported into any third party applications
Besides the Store Code, Stock Code, Stock Description and Bin Location, the Stock Report also provides important accounting information for every item, including Sales, Purchases, Adjustments and Closing Stock Amounts
Stock Report Analysis can help your business to minimise costs through enhanced stock management, streamline procedures to improve delivery performance, and increase inventory turnover through data-backed inventory optimisation
Boost customer satisfaction by using this report to ensure the accuracy and efficiency of your products and stores!
Gain real-time Stock Price related information and take full control of your inventory management, manufacturing and item markup processes
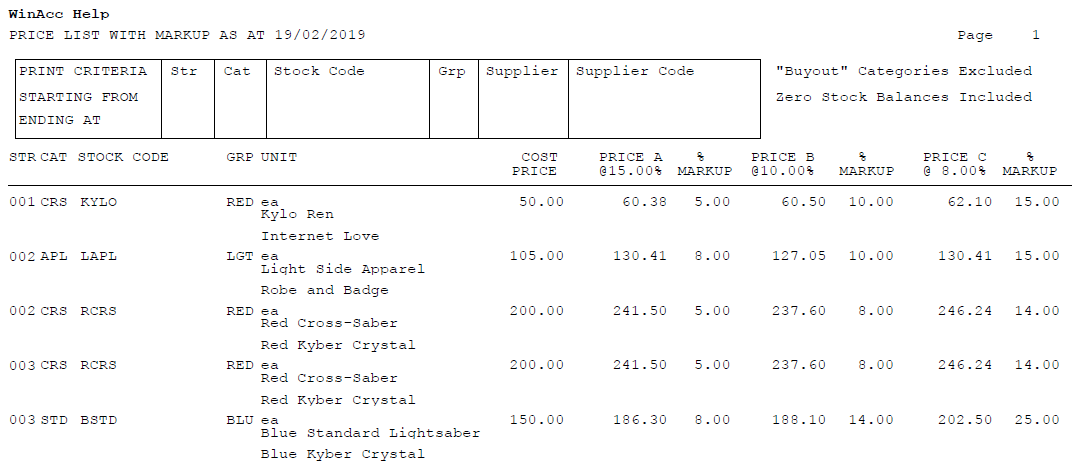
Win Accounting's Stock Control Reporting provides 2 Price List Report variations, making it easier for you to hone in on specific data and analysis:
Choose from the Price List with Supplier Details Report and the Price List with Markup Percentages Report
Both Reports provide valuable inventory and accounting related information, including:
- Store, Category, Stock and Group Code
- Item Description
- Unit Type
- Cost Price
- 3-Tier Markup Price
The Supplier Details Price List Report will also provide you with valuable supplier-related information, such as the Supplier Stock Code and the Creditor Code (both set in the Stock Master File section)
The Markup Percentages Price List Report will provide you with additional information regarding your 3-tier markup price - this report will identify the specific markup percentages set (this is also set in the Stock Master File section)
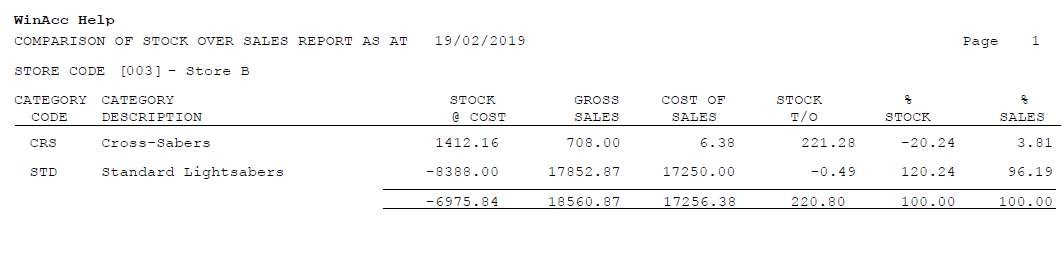
Use the Stock Over Sales inventory turnover comparison report to more efficiently manage your inventory and sales
Ensure your products aren't eating up your working capital or becoming obsolete
The valuable data provided in this report can help you better identify if your company has been overspending by buying too much inventory or losing money due to unnecessary holding costs
The Stock Over Sales Report will aid you in analysing how effectively your company is able to sell the inventory that it buys
Work to improve your cash flow by using this report to better identifying inventory related issues - Rectify them to free up cash tied into your inventory
Use the Stock/Sales Report, in conjunction with the other Stock Control Accounting Reports, to improve the accuracy and effectiveness of your forecasting techniques
Utilise analysis to tweak your sales and marketing procedures, identity top selling products and negotiate improved discount terms with your suppliers
When using the Win Accounting Stock/Sales Report, choose your desired Store to receive valuable data and analysis
The Stock Control Profit Report works in conjunction with the additional Inventory Reports to aid you in better analysing your business and profits in order to form a complete image of the financial health of your company
The Profit Report provides you with either monthly or yearly gross profits, as well as other important accounting information, such as total sales, total cost of sales and number of units sold
This report also provides totals for each unique category and each individual store
Filter the Profit Report by Store, Category, Stock Item, Group, Supplier and/or Supplier Stock Code
Choose to either receive a Full Report with the G/P Movement Percentage, or a Summary Report which only indicated the totals for each Stock Item
The Profit Report can either provide you with Gross Profit: Month-To-Date or Gross Profit: Year-To-Date
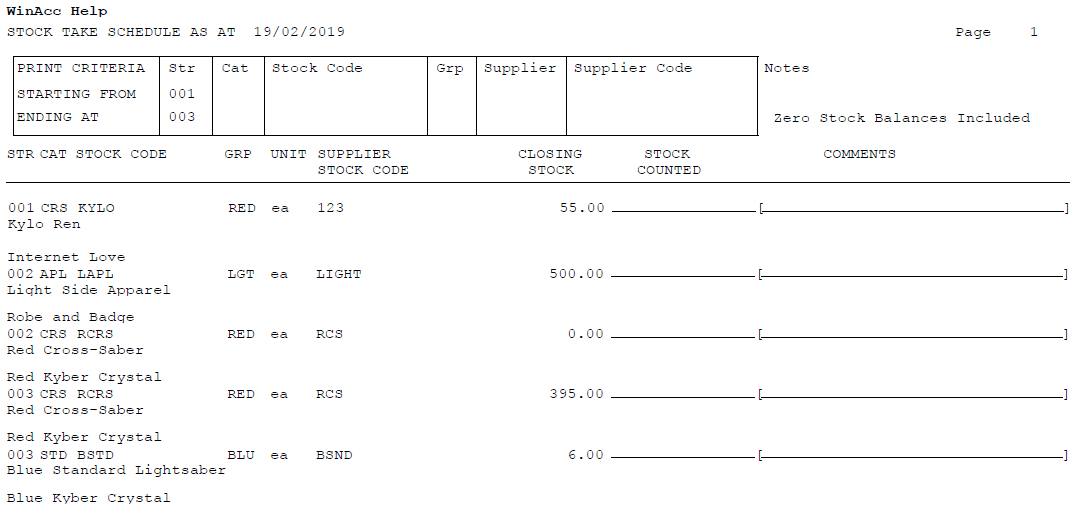
The Stock Take Schedule Report is used to make the Stock Take Process quicker and easier
Filter the report output as necessary and easily export and/or print the report to be used during the physical stock taking process
Filter either by Store, Category, Stock Item, Group, Supplier and/or Supplier Stock Code
Or filter by Bin Location in order to hone in on a specific part of your storage/warehouse
Choose to Include/Exclude Buyout Categories, Zero Stock Balances and/or Closing Balance Amounts
The Stock Take Schedule Report provides an open space where you can note the amount of physical stock counted, as well as a place for the employee to add any stock take related comments
Improve the efficiency and productivity of your inventory management stock take using the Stock Take Schedule Report
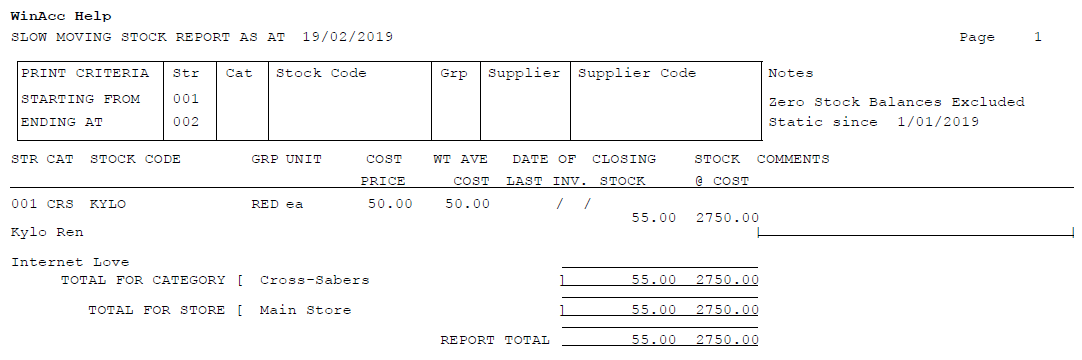
Easily identify your slow moving stock items using the Win Accounting Slow Moving Stock Report
Start by entering a "From Date" - This will identify all Stock Items that remained static from the entered date, up until your entered Accounting Date (set in the System Settings Menu)
Use this valuable data and analysis to increase your inventory turnover, either by applying additional marketing or incentives on your slow moving items, in order to increase their popularity, or by ensuring that you keep fewer slow moving inventory items on hand in the months to come
This information can be used to recognise and focus your capital more effectively towards your top selling products
The Stock Usage Report is provided to help make Inventory Management and Stock Control easier
Quickly and easily receive valuable Stock Usage data, choose to receive a Weekly Stock Usage Report or a Monthly Stock Usage Report
This data can aid you in improving the accuracy and effectiveness of your forecasting and budgeting techniques
Tweak your sales and marketing procedures, identity top selling products and negotiate improved discount terms with your suppliers using the Stock Usage Report analysis
As with the Stock Over Sales Report, the Stock Usage will aid you in determining just how effectively your company is able to sell the inventory that it buys
Filter the Stock Usage Report further by entering the Store, Category and Stock Item Codes before printing
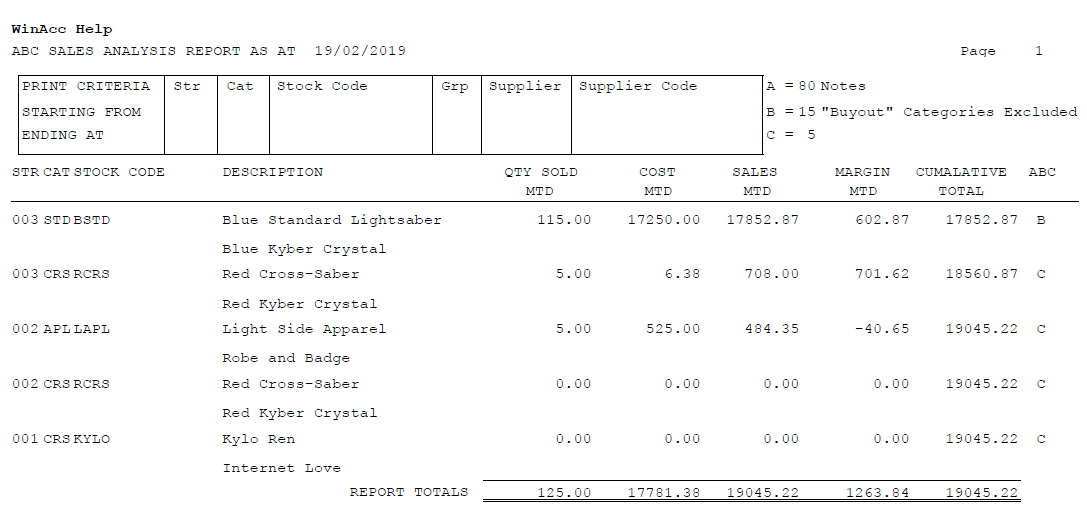
Use ABC Analysis to categorise the impact of your different inventory items - Split items into 3 categories according to how well they sell and how much they cost you to hold
This enables you to easily separate your most important products from your least important ones, making it easier for you to more efficiently use your business resources
Save time and money using this data to better forecast the demand for products, managing your stock levels accordingly
Keep working capital costs low through inventory optimisation and the reduction of obsolete inventory
Using ABC Analysis in Inventory Management presents you with various benefits, including:
- Identify more strategic pricing
- Negotiate better terms with Suppliers
- Enhance End Of Life Management
- Enhance Resource Allocation
The Win Accounting ABC Analysis include: Sales Analysis, Cost Analysis, Margin Analysis and Quantity Analysis
Speed up your Inventory Sales process using the Win Accounting Print Labels Report
This Report makes it easy for you to view, export and print labels -
Print Labels either by Last Receipt or choose the User Specified option to select the specific user
Print Labels by Last Receipt gives you the option to enter a Starting Date for Receipt Labels - Choose the relevant Selling Price Rate to print, either A, B or C
Printing Labels by User Specified gives you the option to choose how many labels to print for each item that meets the filter criteria - Choose the relevant Selling Price Rate to print, either A, B or C
Choose to Include/Exclude Buyout Categories as well as Zero Stock Balance Items